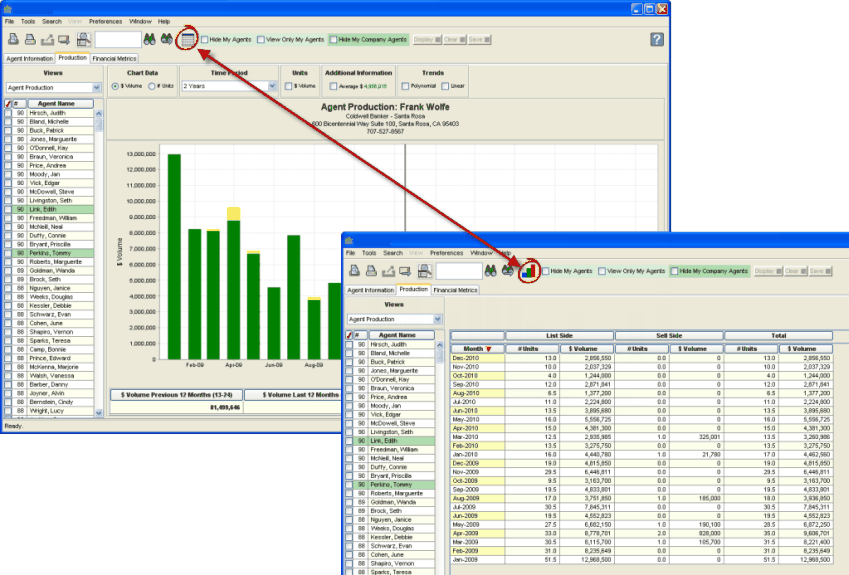
On the Production tab, the charts and their supporting grids (or tables of data) are on a separate screens. Click the chart and grid buttons (circled on the image above) to switch back and forth.

Proficiency Metrics Grid and Chart Area
|
<< <%SKIN-STRTRANS-SYNTOC%> >> Navigation: Proficiency Metrics > Features, Functions, Navigation > Grid and Chart Area |
On the Production tab, the charts and their supporting grids (or tables of data) are on a separate screens. Click the chart and grid buttons (circled on the image above) to switch back and forth.

Proficiency Metrics Grid and Chart Area