The Market Growth charts compare the sales volume of your office(s) (number of units sold and dollar volume) in the selected areas over two time periods and then calculates the growth (or decline) between those periods.
•The underlying information has been formatted for GIS export, i.e. listings with invalid zip codes or cities (due to misspellings, non-standard abbreviations, etc.) will not be included in the data set or calculations.
•Information displayed is list-side only because it is growth, not market share, that is being measured.
•The MLS commission information is based on the percentage that is offered to the cooperating broker (sell side) by the listing agent/office.

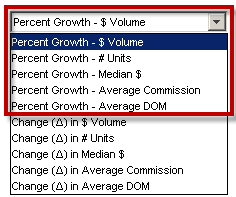
Percent Growth Views
|
•These charts depict the difference in values between the two periods as a percentage of the earlier period for each area that you selected in the search criteria. |
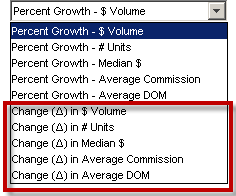
Change in... Views
|
•These charts charts provide a comparison of the values for both periods for each area that you selected in the search criteria. |
Market Average
|
•The Market Average demarcation line (blue) reflects the weighted average of all the areas that were chosen relative to the search criteria. •Available on Percent Growth charts only. |
Change in:
|
•Displays the percentage change over the chart bars. |