MLS Median Price Trend report
•Informs you of the median sold price and transaction trends that have taken place spanning up to the last 10 years in a given MLS.
•Focuses on the most common residential property types (single family/condo/townhouse) because those property types make up the bulk of data in any given MLS.
Note: Not every MLS will have 10 years of data.
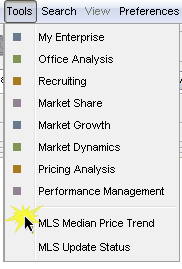
How to access the report
|
•You can access the MLS Median Price trend report from the Tools menu once you have logged into BrokerMetrics and selected an existing tool. •The report is populated based on the MLS you have access too. •If you have access to more than one MLS, the default MLS data displayed is based on alphabetical order of the MLS. |
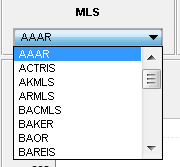
Multiple MLS Access
|
•If you have access to more than one MLS, the default MLS displayed will be based on alphabetical order of your MLS's. •You can switch MLS's by choosing a new MLS from the MLS drop down box. |
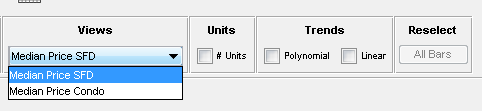
Grids
|
•You have two grid views: oMedian Price SFD - displays sold median $, units sold, average sold price and sold $ per square foot for single family detached properties up to the last ten years broken down by quarter. oMedian Price Condo - displays sold median $, units sold, average sold price and sold $ per square foot for condominiums properties up to the last ten years broken down by quarter. |


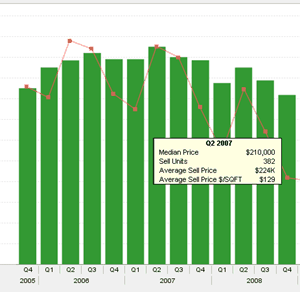
Charts
|
•You have two chart views: oMedian Price SFD - displays sold median $, units sold, average sold price and sold $ per square foot for single family detached properties up to the last ten years broken down by quarter. oMedian Price Condo - displays sold median $, units sold, average sold price and sold $ per square foot for condominiums properties up to the last ten years broken down by quarter. •By default, Units is not displayed on the chart. •The chart is reflective of the collective actions of all buyers and sellers during this time period on a quarter-by-quarter basis across your MLS. •Each quarterly slice in the chart is a representation of how existing market forces affect buyer/seller behavior from both a price and market activity perspective. •The chart illustrates where the market has come from and "points" to where it is headed. |