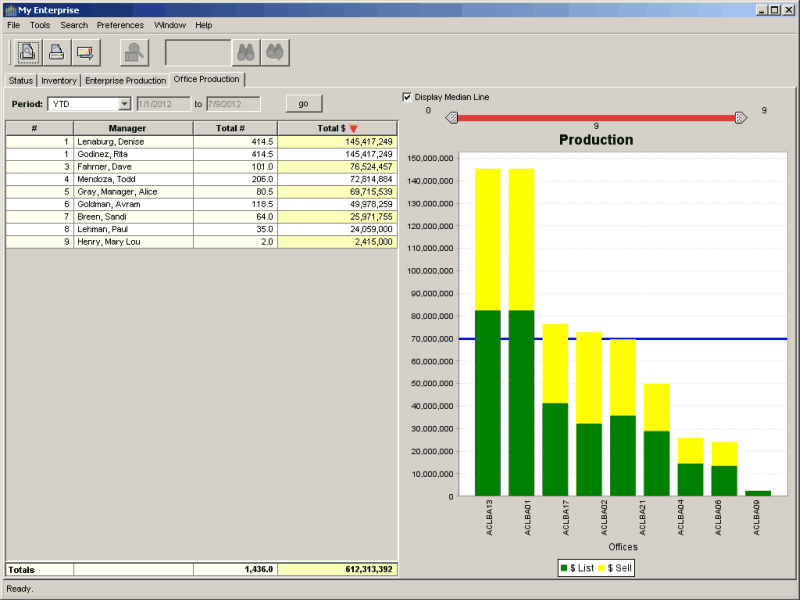
Office Production provides an overview of your offices production and their relative ranking.
•The information in the left grid is initially sorted on the office ranking.
•Ranking is based on total production.
•Default time period is year-to-date.
Customize the view
•Change the number of offices shown on the graph and the group of offices shown by moving either end of the slider.
For example, positioning the ends of the slider as shown here will result in a display of 21 offices on the graph, beginning with the 11th office and ending with the 31stoffice.
•Change the time period by clicking on the menu above the grid and clicking on another selection.
Sort the information
•To sort on a different category of information, click on another column title.
•Click on the column title again to sort in the reverse order.
•The red triangle indicates the sorted column and the sort order.
More information
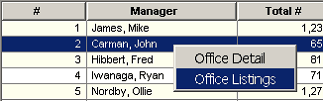
•Right-click on the managers name, then click on Office Detail to view contact information, or on Office Listings for a grid that shows all of the listings associated with the office.
•Click Display Median Line(above the grid) to add a line representing the median total production for your offices.
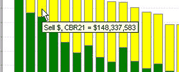
•Hold the mouse pointer over a section of a bar to see the actual value, and to highlight the related row on the grid.