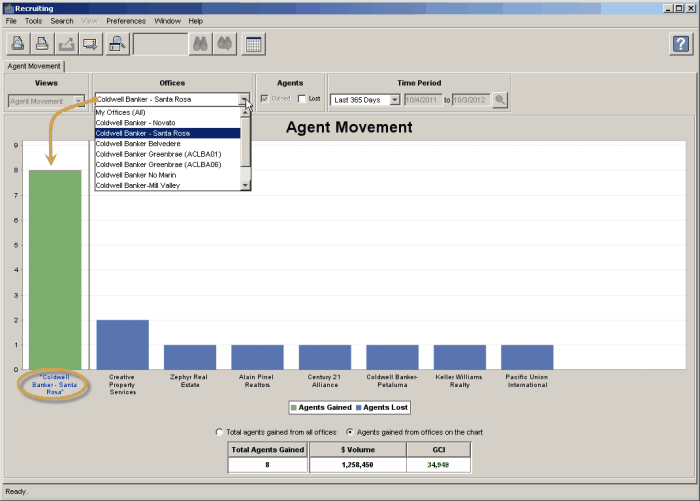
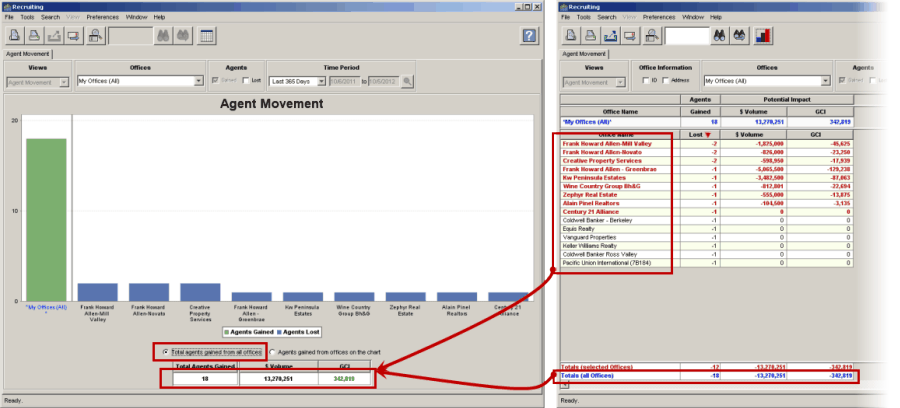
This view shows you the numbers of agents who have moved between offices in your MLS in the last 365 days.

Offices
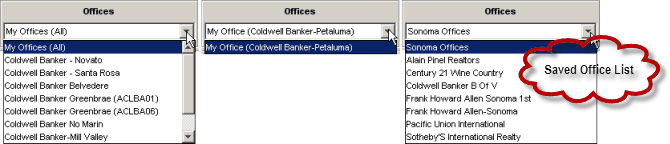
The list will include all of the offices in the list that your search was based on.
Selecting one of the offices from the picklist will show the movement of agents between that office and any other office in the MLS.
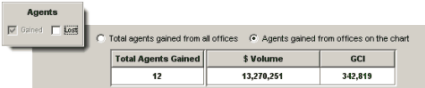
Agents

•Gained: When this box is checked, thegreenbar to the left of the gray line will depict the number of agents who came to the office(s) indicated from another office in the MLS during the selected time period. These are the agentsgained fromthe offices to therightof the gray line, and the agents the other offices lost.
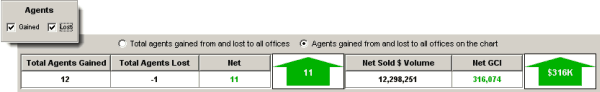
•Lost: When this box is checked, thebluebar to the left of the gray line depicts the number of agents who left the office(s) indicated and joined another office in the MLS during the selected time period. These are the agents gained by the offices to the rightof the gray line.
Time Period
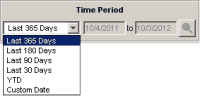
Analyze agent movement during different time periods.
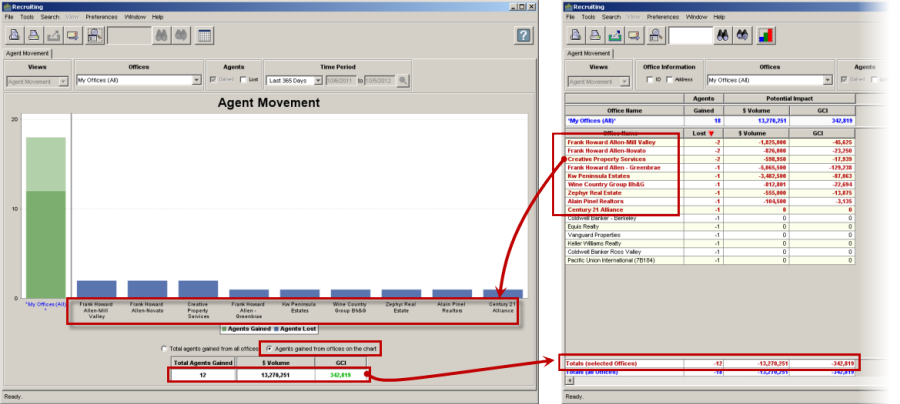
Total agents gained from all offices
This selection will base the calculations on all offices that are shown in the grid, even though all of them may not be plotted on the chart (only the offices in bold red text are plotted on the chart).
Key Information
•When either Agents GainedorAgents Lost is checked, this area will show the total number of agents gained or lost and their total production and GCI for the 365 days prior to the date of each agent's move.
•When both Gained and Lost are checked (bottom left, above), this grid will show thenetgain or loss:
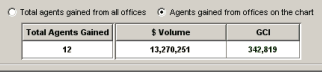
There are two options for calculating the values shown in the Key Information grid:
1.Total agents gained from all offices
2.Agents gained from offices on the chart
Agents gained from offices on the chart
This selection will base the calculations on all offices that are selected in the grid (in bold red text) and plotted on the chart.