ContentVideos |

Office Information
![]()
Check one or both boxes to add this information to the grid.
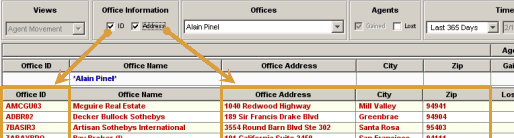
Offices
![]()
This list will include the following:
•My Office,My Offices (All)or the Office List Name that you selected on the search screen. This selection shows the movement of agents between any of your offices or any of the offices in the Office List and another office in your MLS. It will not reflect agents that only moved between offices within the group.
•Each office that is included in the group of offices. Selecting an office from the picklist will show the movement of agents between that office and any other office in the MLS, including movement between offices within the group.
Agents
•Gained: When this box is checked, the green bar to the left of the gray line will depict the number of agents who came to your office(s) from another office in the MLS during the selected time period. These are the agents you gained from the offices to the right of the gray line, and the agents the other offices lost to you.
•Lost: When this box is checked, thebluebar to the left of the gray line depicts the number of agents who left your office(s) and joined another office in the MLS during the selected time period. These are the agents you lost and the other offices gained.
![]()
See Charts
Time Period
Analyze agent movement during different time periods.
![]()
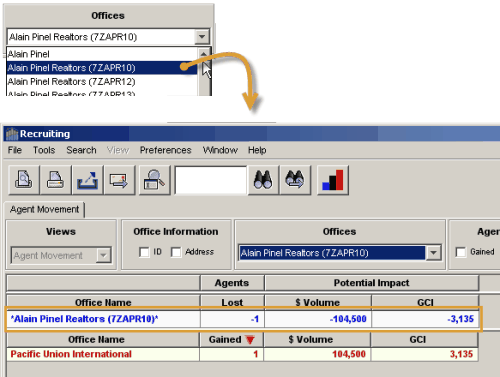
First Grid
This grid shows the office or group of offices from which agents were lost and to which agents moved from any other office in the MLS.
![]()
Second Grid
This grid shows the offices in the MLS that lost agents to or gained agents from the office or office group shown in the first grid (#5 above).
•Rows in red are plotted on the chart.
•Click on a row to select it or deselect it. Selected rows are plotted on the chart and included in the calculation of totals shown in the Totals (selected Offices) row (see No. 6 below).
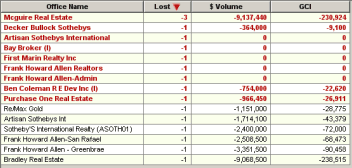
Second Grid Totals
•The row in red shows the totals for all of the selected rows in the second grid. The values will automatically recalculate as rows are selected or deselected.
•The row in blue shows the totals for all of the rows in the second grid. It corresponds to and is the reverse of the values shown in the first grid. Remember, the gain by the office group in the first grid is the loss of the offices shown in the second grid.
![]()