Offices
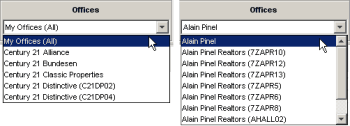
The office list you selected on the search page plus all of the offices included in the group. Select an office to see the movement of agents to and from that individual office.
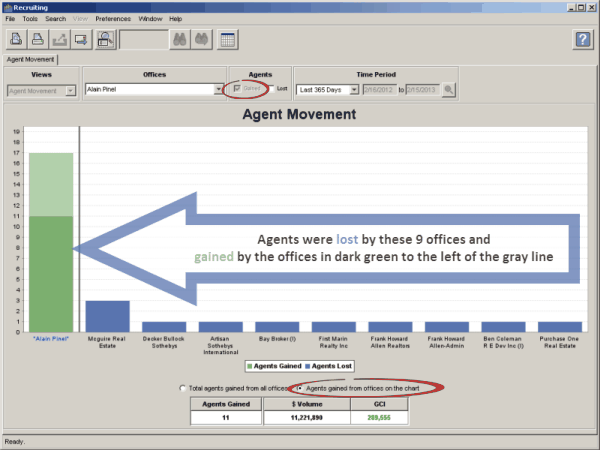
Agents
![]()
•Gained: When this box is checked, thegreenbar to the left of the gray line will depict the number of agents who came to the group of offices or office selected in the Offices drop down menu from another office in the MLS during the selected time period. These are the agents gained from the offices to the right of the gray line, and the agents the other offices lost.
•Lost: When this box is checked, the blue bar to the left of the gray line depicts the number of agents who left he group of offices or office selected in the Offices dropdown menu and joined another office in the MLS during the selected time period. These are the agents lost to the offices to the right of the gray line, and the agents the other offices gained.
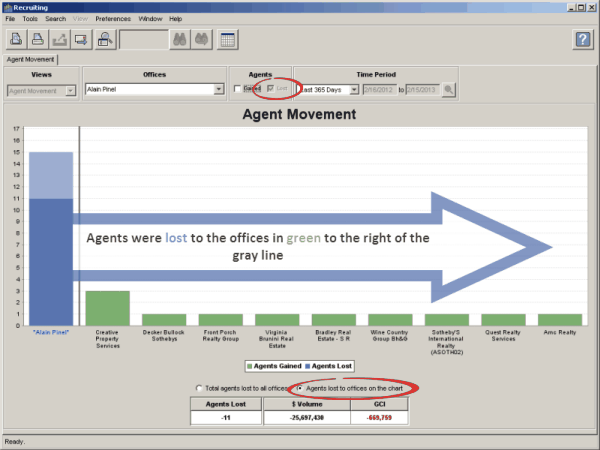
•Gained and Lost: Both the number of agents you gained from other offices, and the number of agents you lost to other offices are shown.
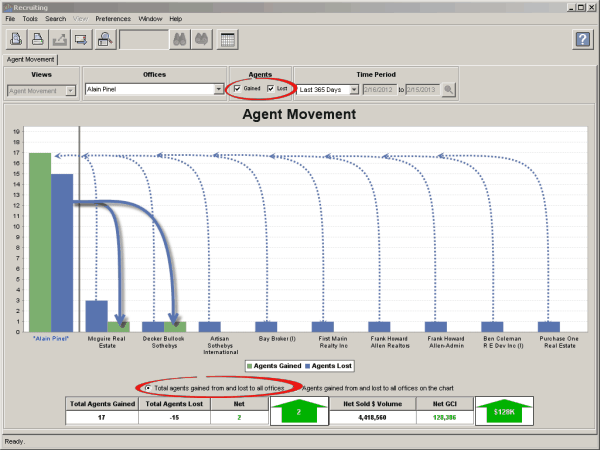
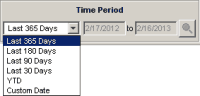
Time Period
Analyze agent movement during different time periods.
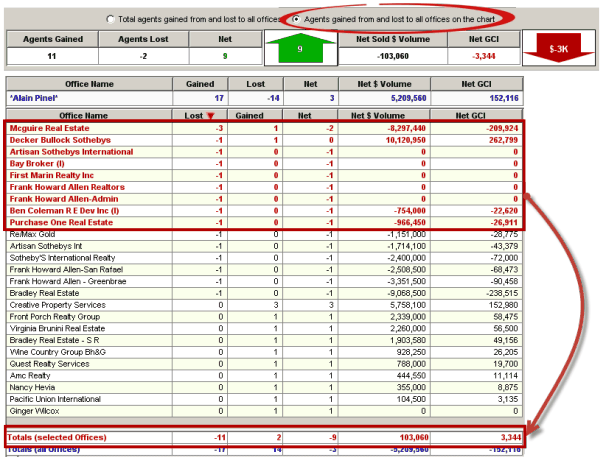
Key Information
![]()
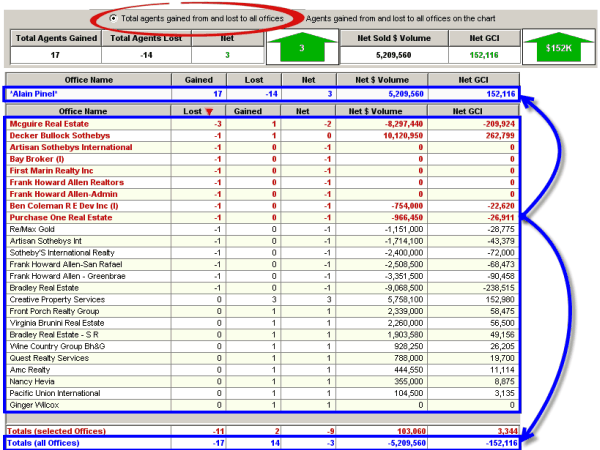
This selection will display totals based on only the offices that are plotted on the chart. It corresponds to the red Totals (selected Offices) line on the grid:
![]()
This selection displays totals based on all of the offices that are shown in the grid, whether or not they are plotted on the chart.