The chart and grids on this tab provide an overview of the listings that are currently for sale and under contract for the agents within your office.

Statuses
![]()
Show or hide Active, Contingent and/or Pending listings by clicking in the checkboxes above the chart. The number of listings in each category is shown in parentheses.
DOM/DUC Slider
![]()
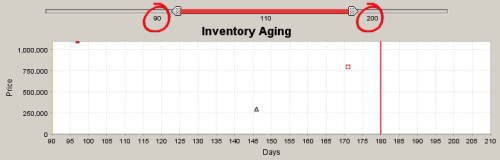
Change the range of Days on Market and/or Days Under Contract shown on the graph by moving either end of the top slider.
For example, positioning the ends of the slider as shown below will result in a graph showing properties that have been on the market for 90 to 200 days.
Price Slider
![]()
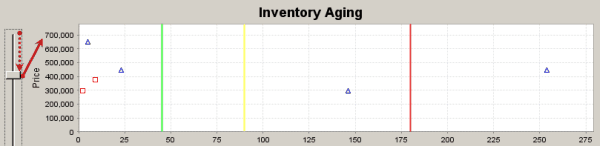
Change the range of prices shown by moving the vertical slider at the left of the chart up or down.
Listing Information
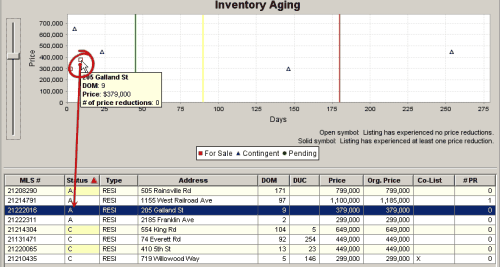
Hold the mouse pointer over a data point on the chart to highlight the corresponding row on the grid and to view listing information in a tooltip.