Production provides an overview of your agents production over 12 or 24 complete calendar months.

Trend Line
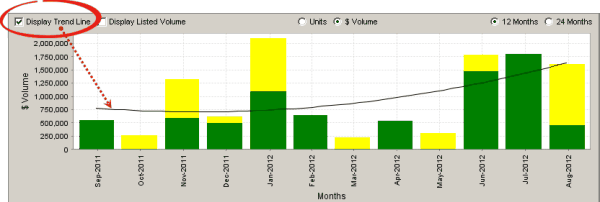
Applies a polynomial trend line to the chart, which uses a Linear Least Squares calculation method.
Listed Volume
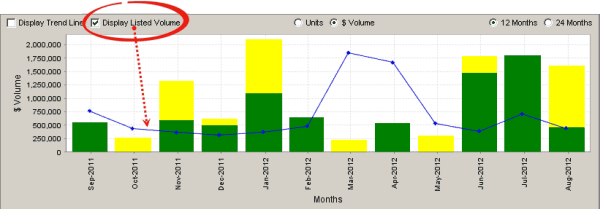
Charts the total dollar or unit volume of properties that were listed by the agent during each month.
Units/$ Volume
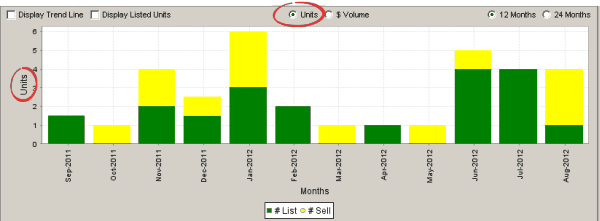
Chart the agent's production in Unit volume or $ Volume.
Time Period
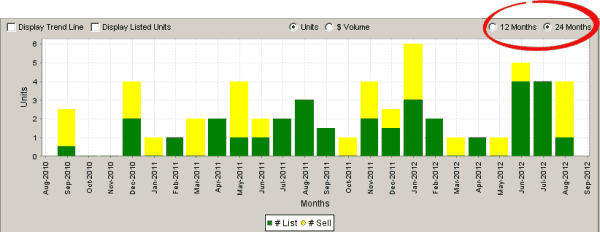
Chart the agent's production for either 12 or 24 full calendar months.
Agent Grid
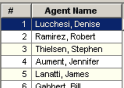
The names in this grid are initially sorted by the ranking of each agent based on total production (Total $) for the previous 12 months.
Click on an agent's name in this grid to view the agent's production on the chart and in the grid below the chart.
Agent Production Chart
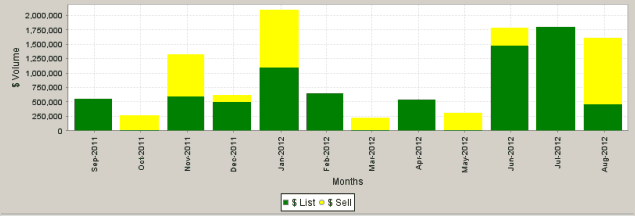
The bars show list-side sold (green) + sell-side sold (yellow).
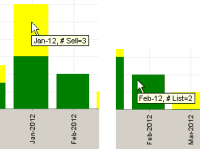
Agent Production Grid
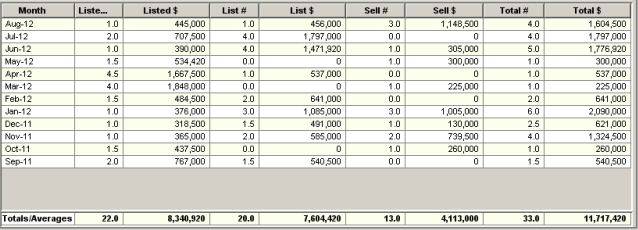
Each row in the grid corresponds to a bar on the chart. Hold the mouse pointer over a chart bar to highlight the corresponding row in the grid.