Monitor Performance allows you to track your agents™ performance against their goals in six areas:
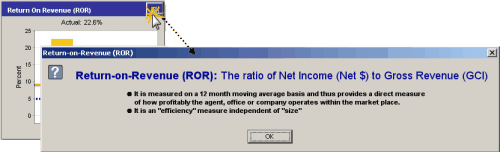
1.Return on Revenue (ROR)
2.Selling Office Commission (SOC)
3.Closed-To-List Ratio (C/L)
4.Desk Cost Coverage (DCC)
5.Average Marketing Time (AMT)
6.Transactions-To-List Ratio (T/L)

Agent Grid
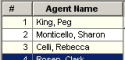
Click on a name in this list to select an agent and view the metrics pertaining to the agent.
Goal & Target Indicators
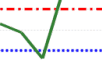
•The dashed red lines represent the annual goals.
•The dotted blue lines on the Return on Revenue and Desk Cost Coverage charts represent the minimum target (acceptable) values for these metrics.
More Information
![]()
Click on this button for a detailed explanation of the information displayed.