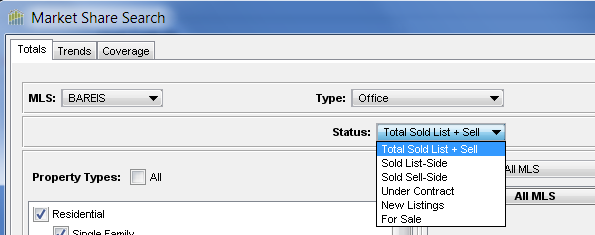
Grid/Chart Name
|
Description
|
Total $ Volume (default)
|
Total sales (in $ volume), displayed on stacked bars broken down by list side and sell side.
|
Total # Units
|
Total number of closed transactions, displayed on stacked bars broken down by list side and sell side.
|
List $ Volume
|
Total closed list side transactions (in $ volume), displayed as green bars.
|
List # Units
|
Total number of closed list side transactions, displayed as green bars broken.
|
Sell $ Volume
|
Total closed sell side transactions (in $ volume), displayed as yellow bars.
|
Sell # Units
|
Total number of closed sell side transactions, displayed as yellow bars.
|
Total $ - List $ - Sell $
|
Total sales (in $ volume) are displayed for Total List + Sell , Total List-Side , and Total-Sell Side as three separate, side-by-side bars: light green, dark green, and yellow.
|
Total # - List # - Sell #
|
Total number of closed transactions are displayed for Total List + Sell, Total List-Side, and Total-Sell Side as three separate, side-by-side bars: light green, dark green, and yellow.
|
Sold Price vs. Original Price (List Side)
|
Compares Sold Price vs. Original Price (SP/OP) ratios for list-side transactions.
|
Sold Price vs. Original Price (Sell Side)
|
Compares Sold Price vs. Original Price (SP/OP) ratios for sell-side transactions.
|
Total $ Volume Per Producing Agent
|
The average closed $ Volume per producing agent for an office, broker or custom market share group. This is an agent production metric independent of office size.
|
Total # Units Per Producing Agent
|
The average closed # Units per producing agent for an office, broker or custom market share group. This is an agent production metric independent of office size.
|
