Market Share Trends performs market share trend and time period comparison calculations, i.e. how your business (office/company and/or competition) is changing over time. There are two types of time periods available for searching:
•Rolling 12 Month Time Period - Annual sales totals for a rolling twelve-month period •Comparison Periods - Time-period over time-period comparison of the selected status variable.
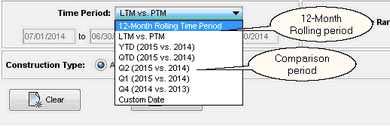
•LTM vs PTM - Last 12 (full) Months of data as compared to the Previous 12 (full) Months of data •YTD (2015 vs 2014) - Jan 1, 2015 to yesterday's date data as compared to same period in 2014 •QTD (2015 vs 2014) - current quarter 2015 start and end dates as compared to same period in 2014 •Q2 (2015 vs 2014) - previous quarter start and end dates as compared to same period in prior year •Q1 (2015 vs 2014) - 2 quarters ago start and end dates as compared to same period in prior year •Q4 (2014 vs 2013) - 3 quarters ago start and end dates as compared to same period in prior year •Custom Date - user specified date range will be compared to same period in prior year |
The available charts and grids will vary depending on which time period is chosen when executing a search in Market Share Trends.
Charts/Grids |
Time Period |
Views |
|
Rolling 12 Month Time Period |
•Annualized $ Volume - Displays the dollar volume accrued over the previous 12 consecutive months in a rolling time span that encompasses the given month's data plus all of the data from it's preceding 11 months. • Annualized Market Share % ($ Volume) - Displays the percent of market share by dollar volume, that the entity (office, broker, or group) has actualize over the previous 12 consecutive months in a rolling time span that encompasses the given month's data plus all of the data from it's preceding 11 months. •Annualized # Units - Displays the number of units accrued over the previous 12 consecutive months in a rolling time span that encompasses the given month's data plus all of the data from it's preceding 11 months. •Annualized Market Share % (# Units) - Displays the percent of market share by number of units, that the entity (office, broker, or group) has actualize over the previous 12 consecutive months in a rolling time span that encompasses the given month's data plus all of the data from it's preceding 11 months. |
|
Comparison Periods |
•Change in $ Volume - Displays the change in the dollar volume for the entity (office, broker, or group) as distinguished by the two specified time periods selected in the search. •Change in Percent Market Share - $ Volume - Displays the market share percentage change by dollar volume for the entity (office, broker, or group) as distinguished by the two specified time periods selected in the search. •Change in # Units - Displays the change in the number of units for the entity (office, broker, or group) as distinguished by the two specified time periods selected in the search. •Change in Percent Market Share - # Units - Displays the market share percentage change by number of units for the entity (office, broker, or group) as distinguished by the two specified time periods selected in the search. |

