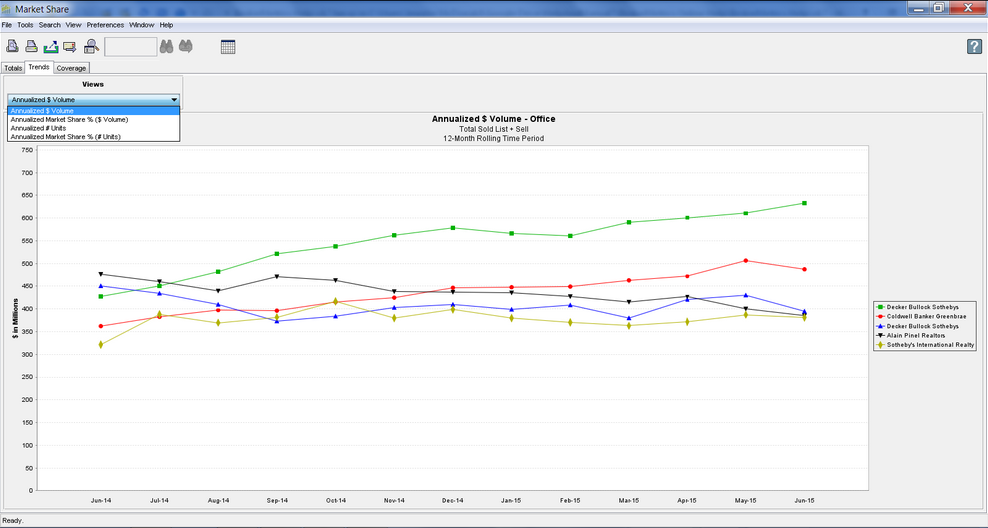
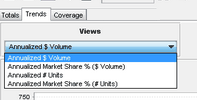
Charts twelve-month production totals for the last twelve full months for each of the offices, brokers or Custom Market Share Groups.
The first five entities, ranked on the most recent months values, are plotted on the chart by default. All entities are shown in the grid (see below).

Each data point (node) on the charts is comprised of 12 consecutive months of data, rolling forward in time on a monthly basis. The value associated with each node encompasses that months data plus all of the data from the preceding 11 months.
For example:
The Jun-15 data point begins on 7/1/14 and ends on 6/30/15; it includes all of the data for the following 12 months:
Note - Drilldowns displays data for the last 24 full months. This allows you to analyze the data for the desired 12 Month Rolling Period. |
|
||||||||||||

