Monitor Performance allows you to track your offices performance against goals in six areas:
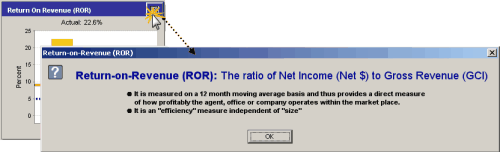
1.Return on Revenue (ROR)
2.Selling Office Commission (SOC)
3.Closed-To-List Ratio (C/L)
4.Desk Cost Coverage (DCC)
5.Average Marketing Time (AMT)
6.Transactions-To-List Ratio (T/L)
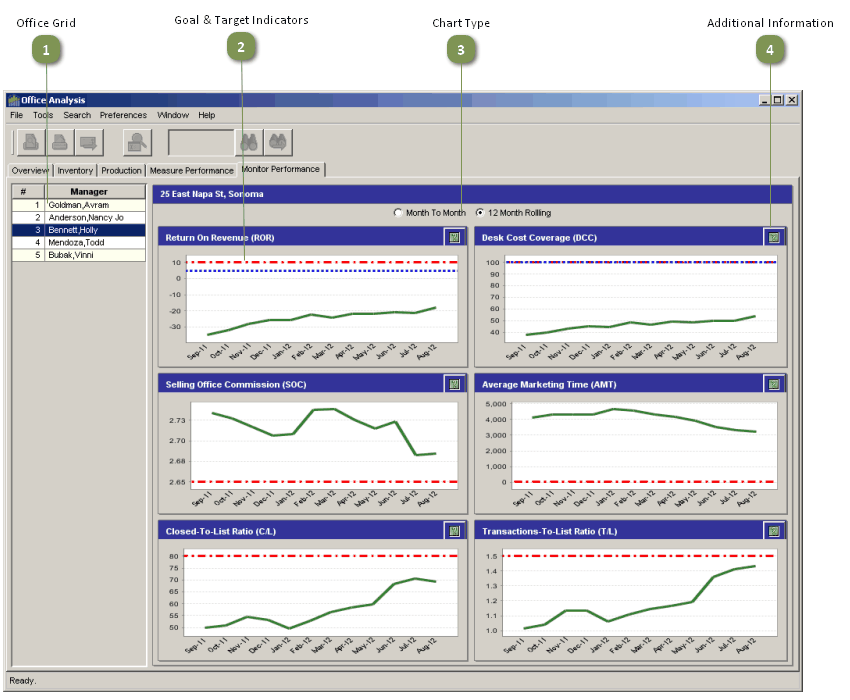
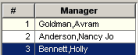
Office Grid
Click on a name in this list to select an office and view the metrics pertaining to the office.
Goal & Target Indicators
![]()
•The dashed red lines represent the annual goals.
•The dotted blue lines on the Return on Revenue and Desk Cost Coverage charts represent the minimum target (acceptable) values for these metrics.
Chart Type
![]()
•Month To Month: Monthly totals for the previous twelve months (Month To Month)
For example, If the Month To Month radio button is selected, the time period represented by the Mar-12 data point is March 1 through 31, 2012.
•12 Month Rolling: Annual totals for the previous twelve months (12 Month Rolling) (default display).
For example, the data point for Mar-12 on the Average Marketing Time chart represents the average number of days on market for all properties during the period April 1, 2011 through March 31, 2012.
Additional Information
![]()
Click on this button for a detailed explanation of the information displayed.