Measure Performance provides a graphic display of productivity data so that you can:
•Gauge the performance of offices alone and relative to other offices within your authority
•Analyze the effects of changing certain factors

Office Grid
•Click on a name in this list to select an office and view the metrics pertaining to the office.
Spinners
![]()
•Use these controls to increase or decrease the numbers and view the net effect of these changes on the charts and meters, and in the Actual/What If summary grid.
•Click on the up or down arrows, or enter a new number directly into the box.
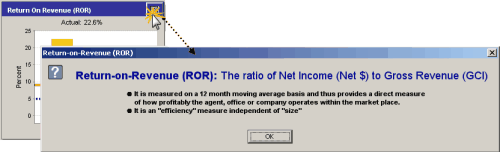
Additional Information
![]()
•Click on this button for a detailed explanation of the information displayed.
Reset
![]()
•To reset variables that were changed using the spinners back to the actual values, click the Reset Actuals button at the top right.
What If...
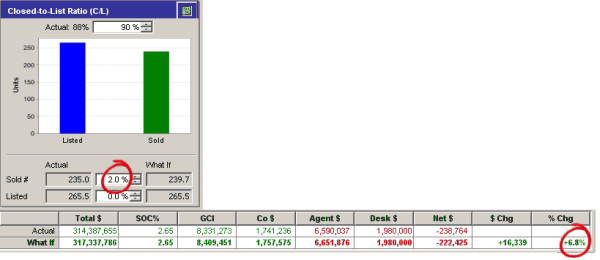
This grid demonstrates the effects of changing one or more factors.
![]()
For example, using the spinners to increase the Sold # by 2 percentage points in the Closed-to-List Ratio panel increases the Total $, GCI, Co $ and Agent $, increasing the Net $ by 6.8%: