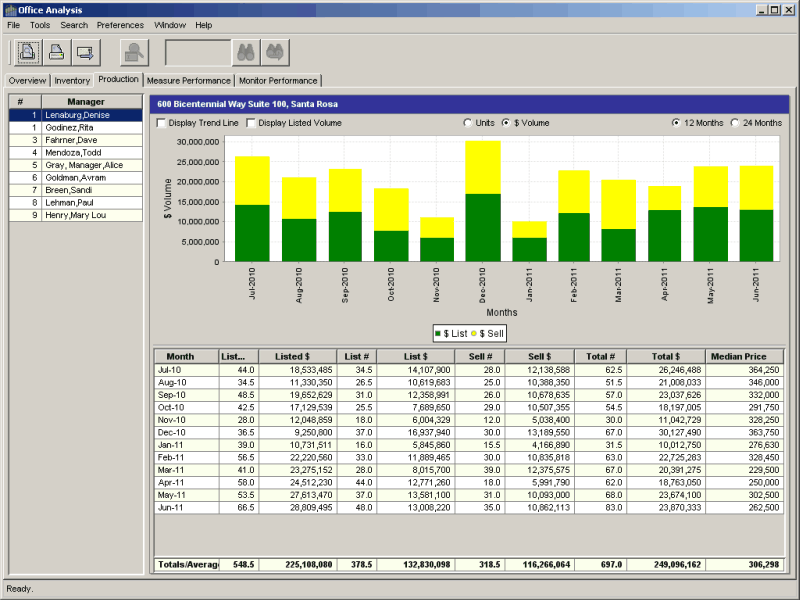
Production provides an overview of your offices production and their relative ranking.
•The information in the left grid (Office Grid) is initially sorted by the ranking of each office based on total production (Total $).
•Default time period is 12 months.
Customize the view
Click the appropriate radio buttons above the bar chart to:
•Display Units or $ Volume (default)
•View data for 12 months (default) or 24 months
Sort the information
•To sort on a different category of information, click on another column title.
•Click on the column title again to sort in the reverse order.
More information
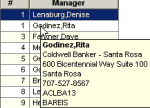
•Office Grid: Hold the mouse pointer over a row in the Office Grid to see the managers name, office name, address and telephone number, and the office code.
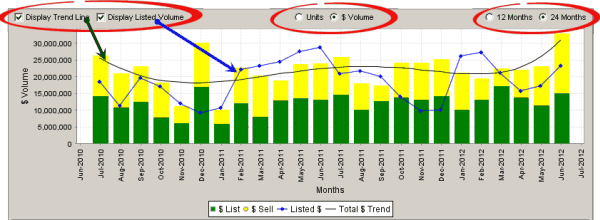
•Click Display Trend Line (above the chart) to add a black line representing the trending in total production.
•Click Display Listed $ Volume (or Listed Units) to add this information (depicted on the blue line) to the chart.
![]()
•Hold the mouse pointer over a section of a bar to see the actual value, and to highlight the related rows on the grids.