My Enterprise is the default tool when BrokerMetrics Enterprise is launched, and the Status page is the default view. It contains three sections which together provide an overview of your business.
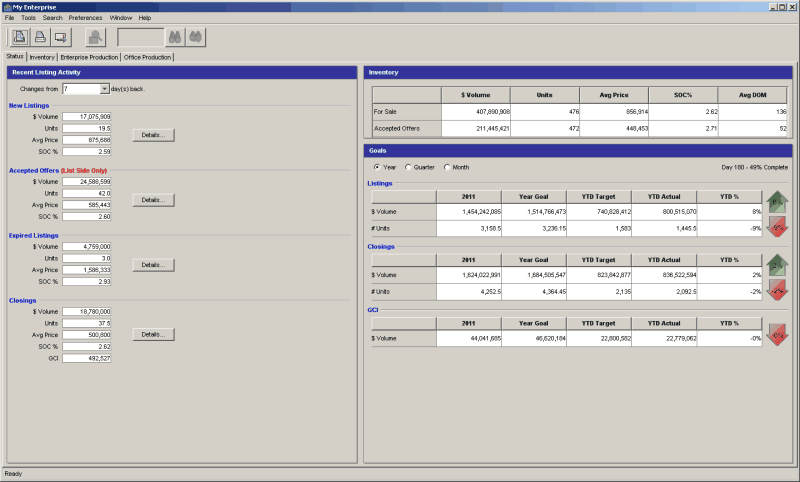
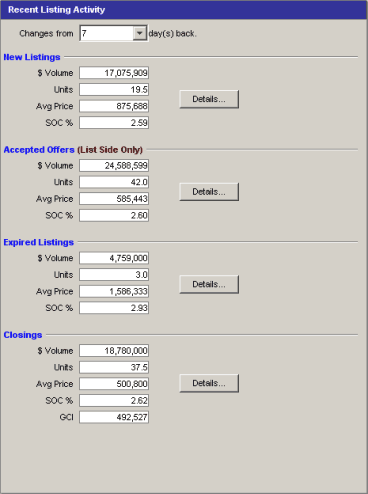
Recent Listing Activity
Shows the total dollar volume, number of units, average price and average commission for new, ratified and expired listings and closings for the most recent number of days you choose. In addition, GCI is given for closings.
•The default time period is 7 days back from today's date.
•Ratified listings are listings for which accepted offers have been recorded.
Change the time period
•Click on the drop-down menu at the top of the section and click on the desired number of days.
•Data is available for up to 31 days prior to today's date.
More information
To view this data summarized for each office within your authority, click on the Details button.
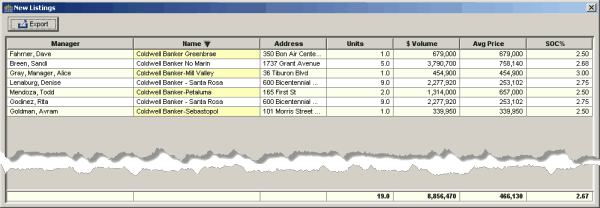
A separate window will display the following information:
•Office manager™s name
•Office name
•Office address
•Number of listings
•$ Volume
•Average Price
•SOC %
•GCI (Closingsdetail only)
Sort the Detail information
•The data will be shown sorted by $ Volume.
•To sort on a different category of information, click on another column title.
•Click on the column title again to sort in the reverse order.
Export the Information
•Click on the Export button to create a csv file for use in other programs such as Microsoft Excel. ![]()
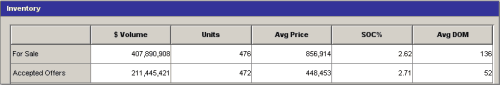
Inventory
•Displays an overview of the current $ volume, number of listings, average price, average selling office commission, and average days on market for active listings and accepted offers.
Goals
Shows actual performance in three categories (listings, closings, and gross commission income) compared to goals for the year-, quarter- or month-to-date, and compared to the previous years actual figures for the time period selected.
•Year-to-date figures are shown as the default view.
•Red or green arrows display the percentages by which the actual figures exceed or fall short of the goal.
•A counter shows the amount of the current selected time period (Year, Quarter, Month) that has passed, in number of days and as a percentage. The goals used in the calculations are based on 0% increase over the previous years actual figures.
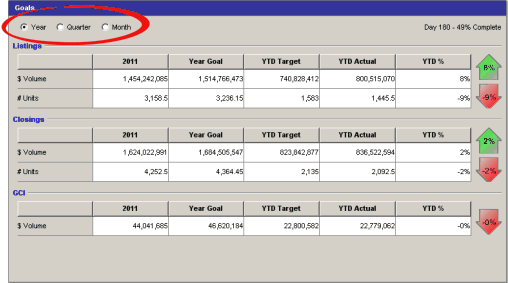
Change the time period
•To display figures based on a different time period, click on one of the radio buttons at the top of the panel.