ContentVideos |
Provides an overview of each agent's production.
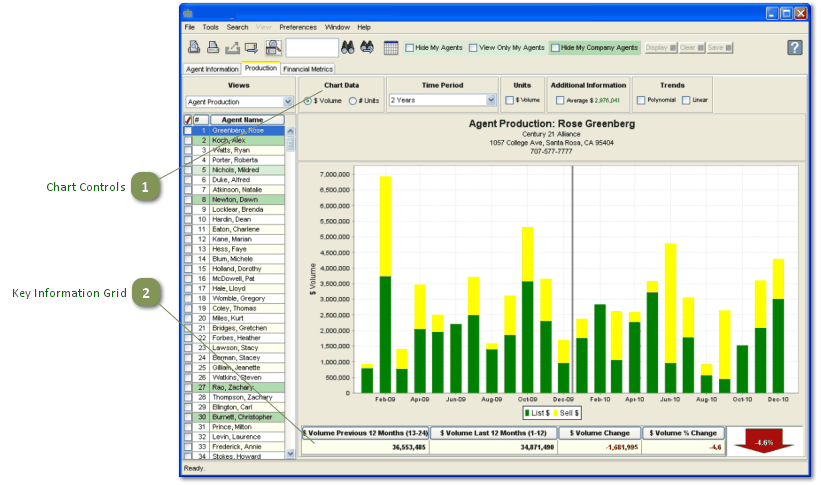
The agent grid (on the left) is initially sorted by total production (Total $ Volume) for the time period selected in the search criteria.
The chart depicts the monthly production for the selected time period for the agent highlighted in the agent grid. The bars on the chart are divided to show list-side (green) and sell-side (yellow) activity.
Chart Controls

These controls allow you to display a variety of information elements, and to change the type of information that is charted:
•Chart Data
•Time Period
•Units
•Additional Information
•Trends
Key Information Grid

•One-Year and Last Calendar Year views
•Two-Year view
