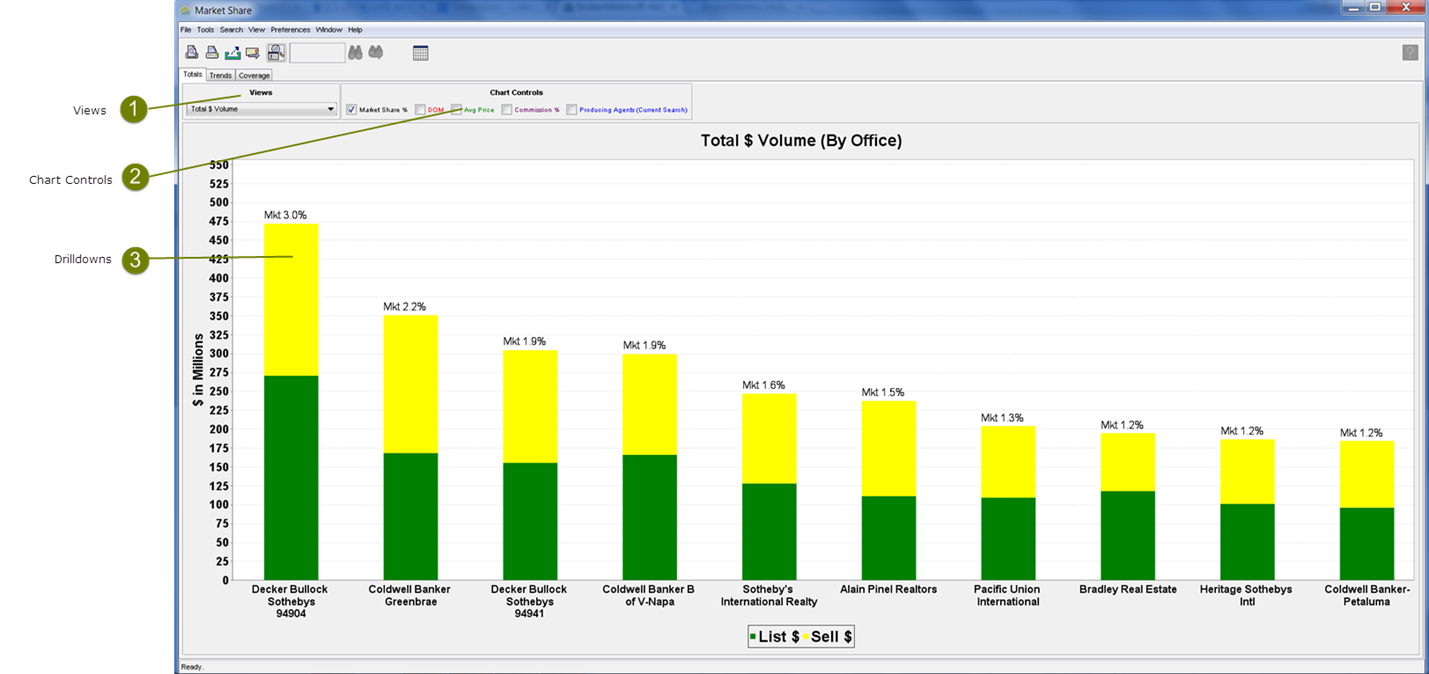
Each chart defaults to the top ten offices, brokers or Custom Market Share Groups based on the general metrics shown below. All charts have a corresponding grid that lists all offices, brokers or CMS Groups.
Market Share Chart Views
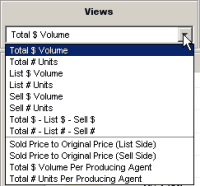 Market Share Chart View Example |
•You can click on the arrow to select a different chart view. •Views displayed in drop down are dependent on which report and criteria are selected in search window. All charts:•Display data for either the top ten offices/brokers/Custom Market Share Groups that meet the search criteria or for the offices selected in the grid. •May be printed, saved as PDF or emailed. •Include the ability to display relevant ancillary information via selection of the Chart controls |
Market Share Chart Controls

|
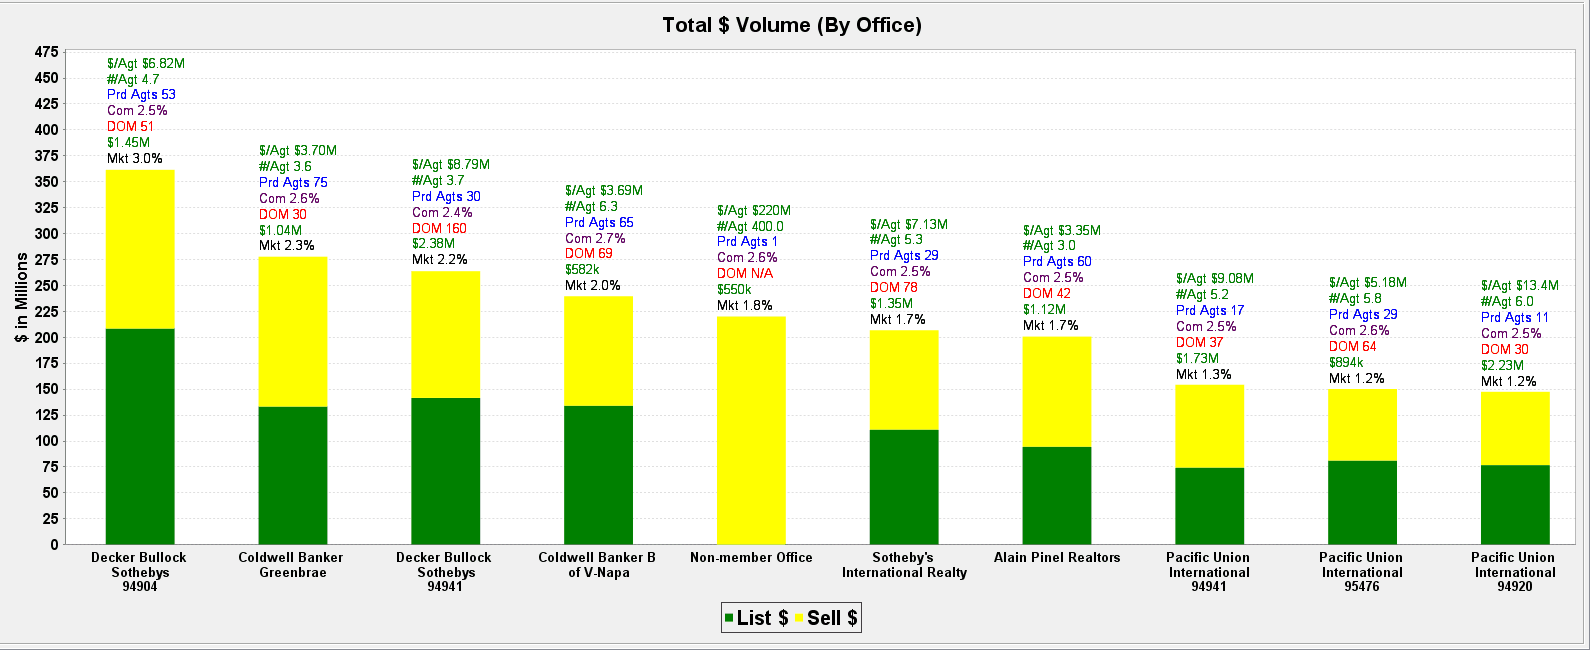
•Chart controls are dependent on the view you select and the type of search performed (i.e Office, Broker or CMS). •You can check the Chart Control boxes to display additional information above each chart bar. •All chart control checkboxes may be selected at the same time. |
|
|
|
•Hover the mouse pointer over the checkbox label for an explanation of the data to be displayed. |
Market Share Drilldowns
 Grid Drilldown  Chart Drilldown |
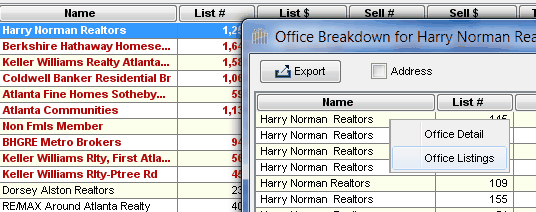
•Office and transaction/property information is available by right-clicking on a row on the grid or bar on the chart. •Office Detail displays address and contact information for the office. •Office Listings displays the office's transactions/properties. |
|
|
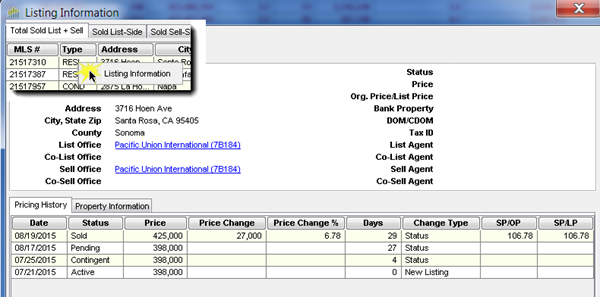 |
•Detailed Listing information is available by right clicking on a row on the Listings grid. |
|
|
|
•Office Breakdown displays information for each office in the Broker or Custom Market Share group. (This selection is available for Broker and Custom Market Share type searches only.) |
|
|
|
•If you have performed a Broker or Custom Market Share group search and choose Office Breakdown you will have the option to see the Office Detail or Office Listings for the selected office. |
Market Share Grid Control
|
•You can easily view ALL of the data in tabular form by clicking on the Grid icon. •Once you are viewing the grid, the control icon is changed to a Chart icon ( •Selecting the Chart icon will return the user to the chart display. |
