ContentVideos |
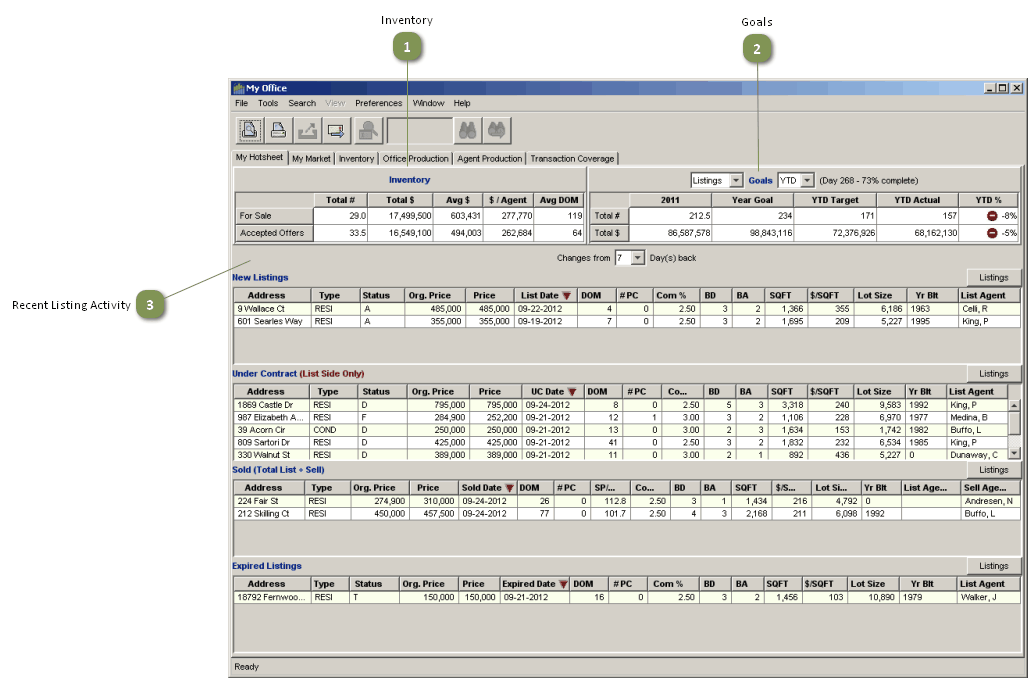
My Office is the default tool that is activated when BrokerMetrics Office is launched, and My Hotsheet is the default view. It contains three main sections which together provide an overview of your business.
Inventory

•Displays the current number of listings, total dollar volume, average price, average listing volume per agent and the average number of days on market for listings that are currently for sale and listings that are currently under contract (for which an accepted offer has been recorded).
Goals

Shows actual performance in three categories (listings, closings, and gross commission income [GCI]) compared to goals for the year-, quarter- or month-to-date, and compared to the previous years actual figures for the time period selected.
•Year-to-date figures are shown as the default view.
•The percentages by which the actual figures exceed or fall short of the goal are calculated for the selected time period and displayed in the last column.
•The amount of the current selected time period (Year, Quarter, Month) that has passed, in number of days and as a percentage. The goals used in the calculations are based on 0% increase over the previous years actual figures.
Recent Listing Activity

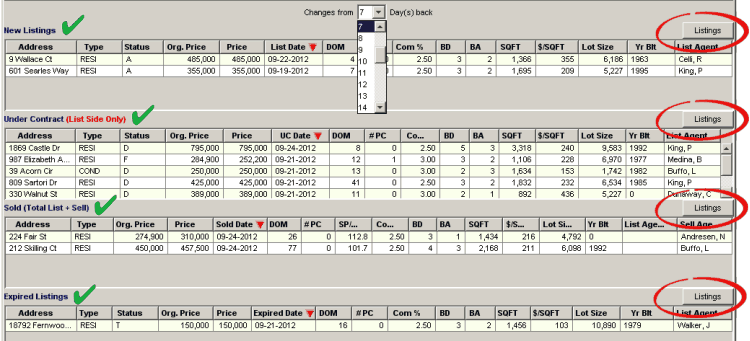
•Each section shows the new listings, listings that went under contract, closings and expired listings for the most recent number of days you choose.
• Click on the Listings button for a grid that shows the individual listings in each category.
