Content➢Grid Videos |
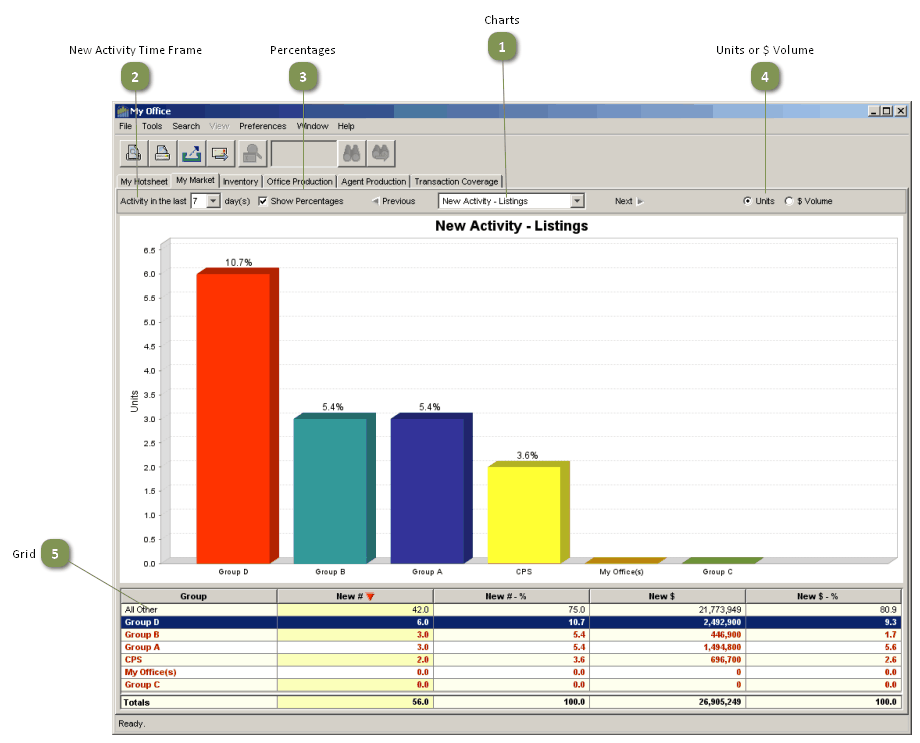
The charts on the My Market tab help you compare the listing activity and market share of your office to your competition. You determine who your competitors are; eight views display new activity and market share statistics.
The first time you click on the My Market tab, you'll be asked to define your market competitors. To make changes later, click on My Market Setup on the Preferences menu.
Charts
•Eight charts on the My Market tab give you information on the performance of your office in comparison with your competitors.
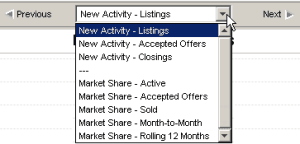
•Navigate to each chart by selecting it from the picklist at the top center of the page, or scroll through the charts by clicking on Next and Previous .
New Activity Time Frame
![]()
•Three charts display New Listings, Accepted Offers (Contingent + Pending) and Closings for the previous 1 to 31 days.
•The default time period is 7 days
•Choose a different time period by clicking on the desired number of days on the picklist at the top left of the page.
Percentages
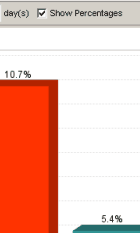
•Hide or show the percentage of the market attributable to each group by unchecking or checking the Show Percentages checkbox.
Units or $ Volume
![]()
•Information may be displayed in numbers of units (default) or dollar volume.
•Click the appropriate radio button at the top right of the page for the desired display.
Grid
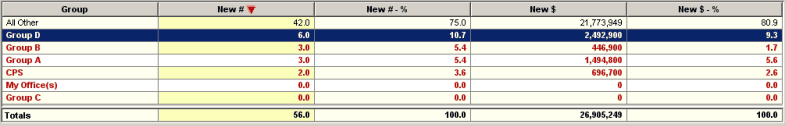
•Ranking of the groups is based on the number of units (default) or dollar volume of the chart subject (New Listings, Accepted Offers or Closings) in the selected time period.
•The bars on the chart and rows in the grid may be reordered by clicking on a column header.
•The ranking will not change, however; the bars on the chart will continue to represent the number (or dollar volume) of New Listings, Accepted Offers or Closings.