ContentVideos |
The information on the Inventory tab provides an overview of the active and under contract (Accepted Offers) listings for your office. The information in the left grid is initially sorted on property status, then on Days on Market (DOM).

Listing Inventory Grid
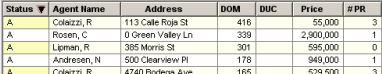
•To sort on a different category of information in the grid, click on a column title. Click on the column title again to sort in the reverse order.
• Each row in the grid corresponds to a symbol on the Inventory Aging Chart.
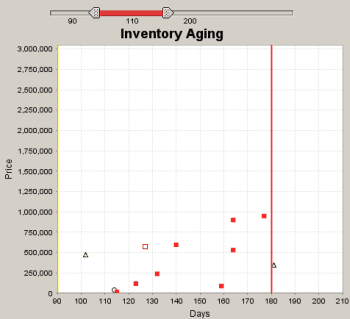
Inventory Aging Chart
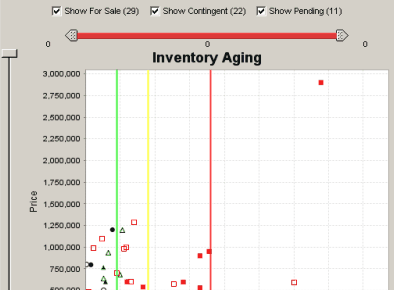
•This chart displays the inventory of active, contingent and pending listings for your office. Each symbol corresponds to a line in the grid to the left of the chart.
•Checkboxes above the chart allow you to show or hide Active, Contingent and/or Pending listings.
•Hollow symbols represent listings that have had no price reductions.
•Solid symbols represent listings that have had at least one price reduction.
•Benchmark lines are placed at the 45-, 90- and 180-day points on the x-axis.
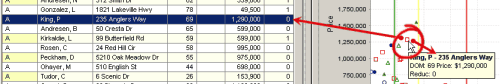
•Hover your mouse pointer over a symbol on the chart to display information about the listing represented by the symbol, and to highlight the corresponding row in the grid.
Price Slider
![]()
•Change the range of prices shown by moving the vertical slider at the left of the chart up or down.
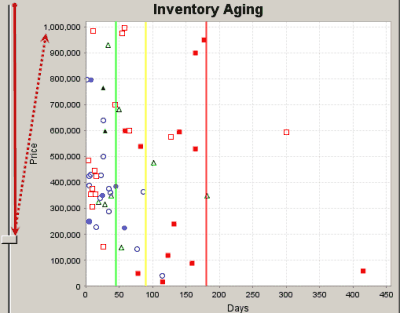
DOM/DUC Slider
![]()
Change the range of Days on Market and/or Days Under Contract shown on the graph by moving either end of the top slider.
For example, positioning the ends of the slider as shown below will result in a graph showing properties that have been on the market for 90 to 200 days.
Inventory Aging Grid
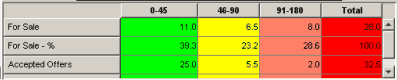
•This grid displays the number and percentages of listings that are currently for sale and under contract (Accepted Offers) by days on market and days under contract(0-45, 46-90, 91-180, 181+ and Total).
•The column shading corresponds to the benchmark lines on the Inventory Aging Chart.