ContentVideos |
The chart and grid on the Production tab provide an overview of your office's production for the last 12 or 24 complete calendar months.

Trend Line
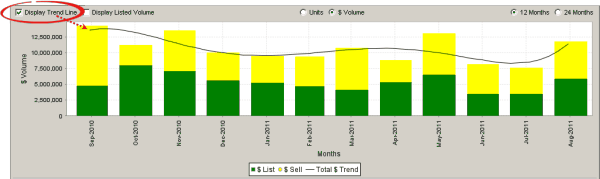
•Applies a polynomial trend line to the chart, which uses a Linear Least Squares calculation method.
Listed Volume
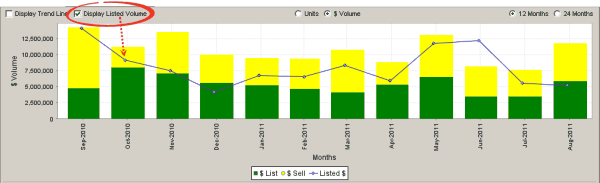
•Charts the total dollar or unit volume of properties that were listed during each month.
Units/$ Volume
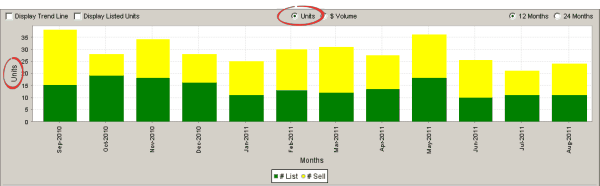
•Chart your office's production in Unit volume or $ Volume.
Time Period
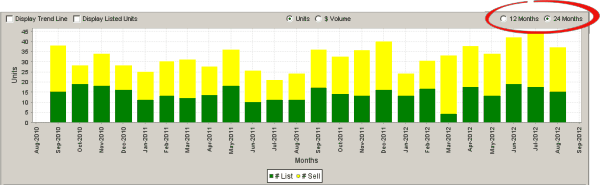
•Chart your office's production for either 12 or 24 full calendar months.
Office Production Chart
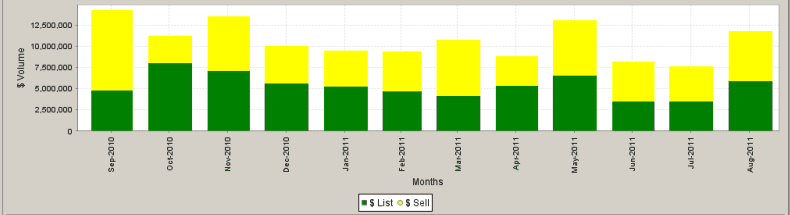
•The bars show list-side sold (green) + sell-side sold (yellow).
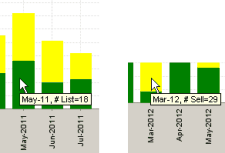
•Hold the mouse pointer over one of the segments of a bar to display the actual value.
Office Production Grid
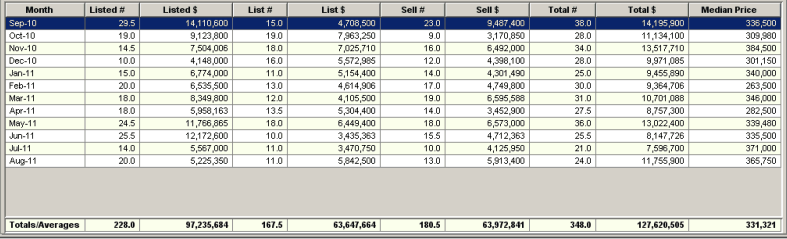
•Each row in the grid corresponds to a bar on the chart.
• Hold the mouse pointer over a chart bar to highlight the corresponding row in the grid.