Content➢Grid Videos |
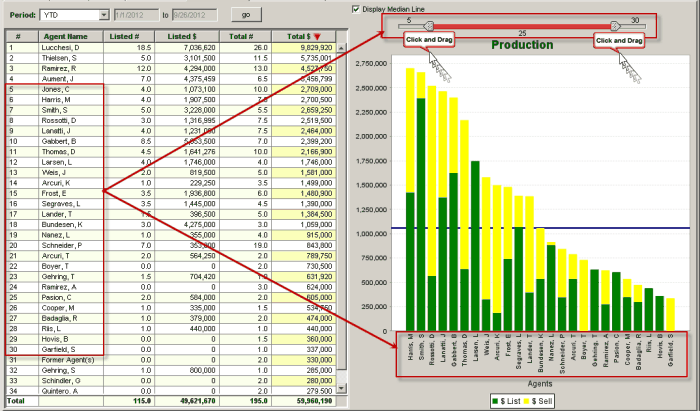
The chart and grid on the Agent Production tab provide an overview of your agents' production.

Grid
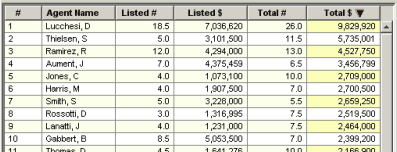
•Agents are ranked based on sold total $ volume of transaction sides (list side + sell side) for the time period selected.
•The grid may be resorted by clicking on another column header (the ranking will now change).
Time Period
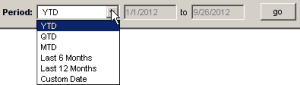
•Select another time period and click the go button to display production figures for that time period.
Production Chart
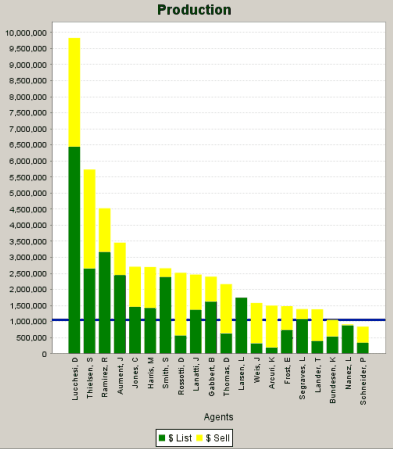
•This chart plots the total $ volume of transaction sides. Each bar has separate segments for list side and sell side production.
Median Line
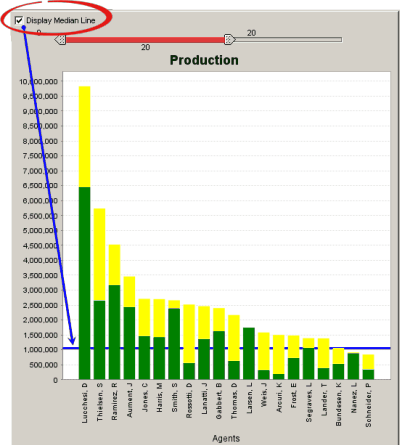
•This line represents the median total production per agent for your office relative to the time period selected. It is based on the production of all agents, not just the ones shown on the chart.
Slider
![]()
•Change the selection and number of agents plotted on the chart by moving the ends of the slider.