Content➢Grid Videos |
The chart and grid on the Transaction Coverage tab show your offices sales and inventory by geographic location (MLS Areas, Cities, Counties, or ZIP Codes). It includes all property types and price ranges. The purpose is to show where the office is transacting its business, and pinpoint areas of strength and weakness.

Period
![]()
•Change the time period over which the calculations are made. Click the go button to the right after you've made your selection.
Percentages
![]()
•Display the percentage of production attributable to each area above the chart bars (corresponds to the values in the Mkt % column in the grid).
Units/$ Volume
![]()
•Base the chart and calculations in the grid on either $ volume or Unit volume.
Area Type

•Change the area type selection here. Click the go button to the right after you've made your selection.
•The area types available will vary by MLS.
Sold/For Sale
![]()
•Show current inventory and accepted offers by clicking the For Sale radio button. Click the go button to the right after you've made your selection.
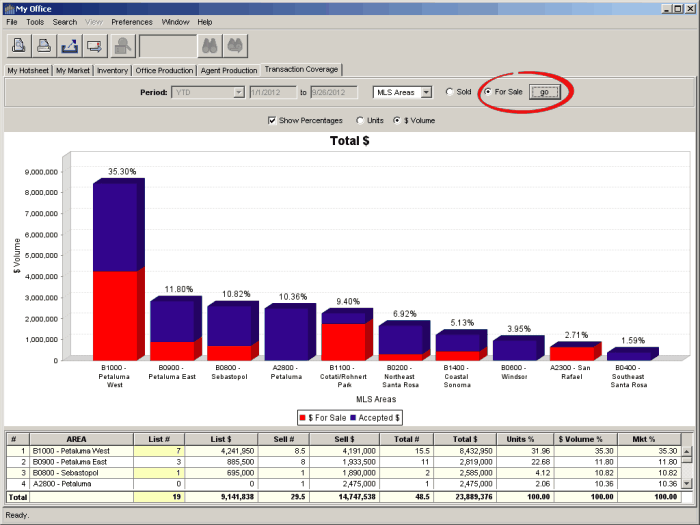
Chart
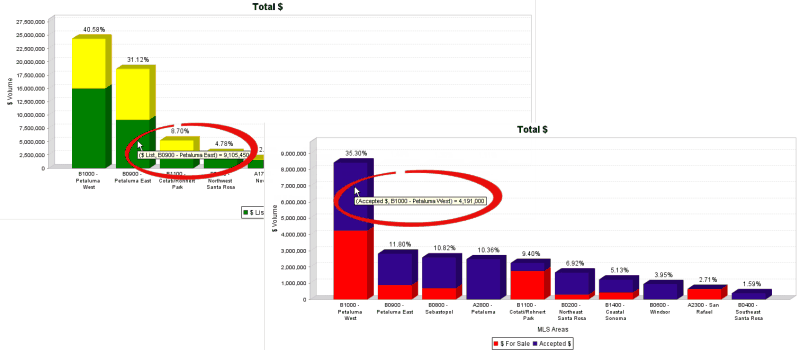
•Display the values for each segment of a chart bar by holding the mouse pointer over it.
Grid
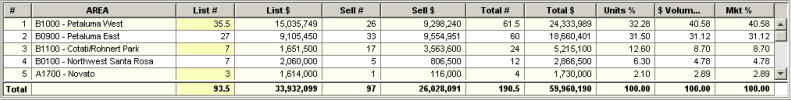
•The grid is sorted on Total $ Volume (Sold); the first ten areas are plotted on the chart.