The SP/OP Comparison grid provides a useful lookup-table to facilitate individual property comparisons relative to: Original Price, Sold Price, Sold Date, # Price Changes, DOM, SP/OP, BD, BA, SQFT, $/SQFT, Lot Size, and Year Built.
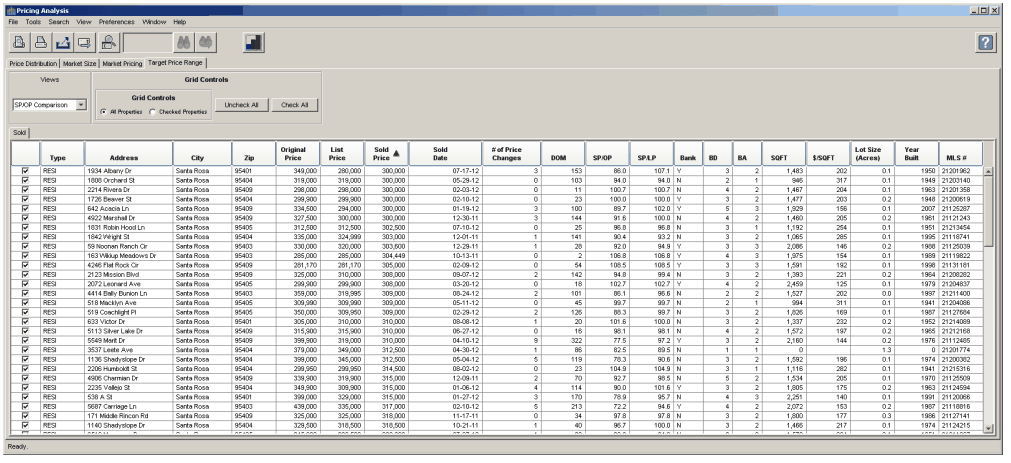
In addition, you have the ability to check or uncheck any property for inclusion in your analysis.
•Unchecked: The row font will change to the italicized mode, and its color will change from black to gray.
•If the default All Properties view is invoked, the unchecked properties will be visible on the chart using a gray symbol color and on the grid using a gray font in the italicized mode.
•If the Checked Properties view is invoked, the unchecked properties will not be displayed on either the chart or the grid, and they will not be included in the calculations in the key information grid below the chart.